Why reported inflation is dishonest
The reported inflation measure is dishonest for two main reasons. One is that it doesn't include all prices, especially house prices and the cost of housing, and as we know from how inflation is created, rising house prices are the main driver of the money supply and monetary inflation. The other is that reported inflation does not capture the real debasement of the currency and the real loss of purchasing power over time.
Real inflation
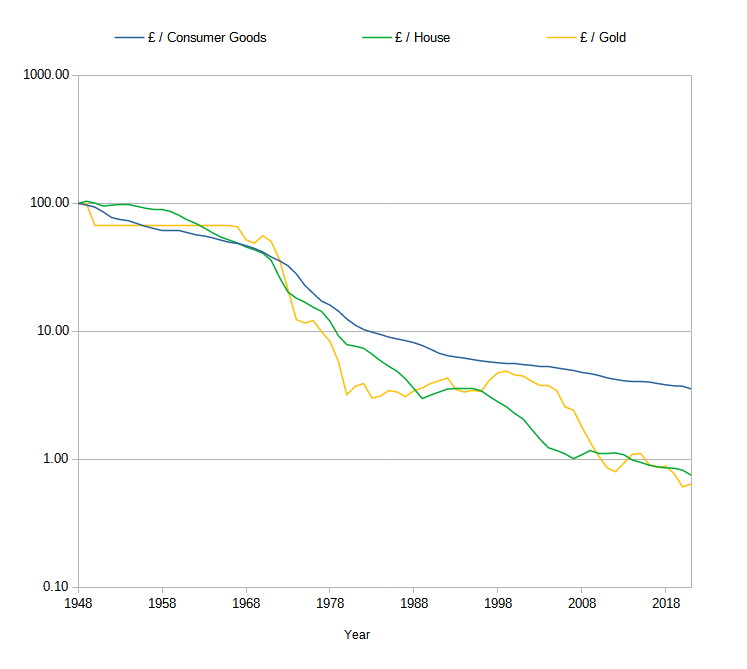
One way to assess the real destruction of the currency by the Bank of England, and therefore the real inflation, is to compare it against other things that hold value over time. If we do this, then we can see the real loss of value of the currency is much greater than the Bank of England inflation rate suggests. The chart below shows the loss of value of the currency compared to consumer, house and gold prices in percentage terms from 1948.

Loss of purchasing power against Consumer, House and Gold Prices, 1948 to 2021. Data derived from the
Office For National Statistics,
Yahoo Finance and the
Nationwide Building Society
According to the Bank of England's inflation rate, the pound sterling has lost 96.5% of its value and hence purchasing power since 1948, which is a considerable amount. However it has really lost more than 99% of its value in terms of houses and gold and highly likely most other assets. Remember, houses (really land) and gold are two very disparate asset classes: one that everyone needs and one that nobody needs.
Real loss of wages
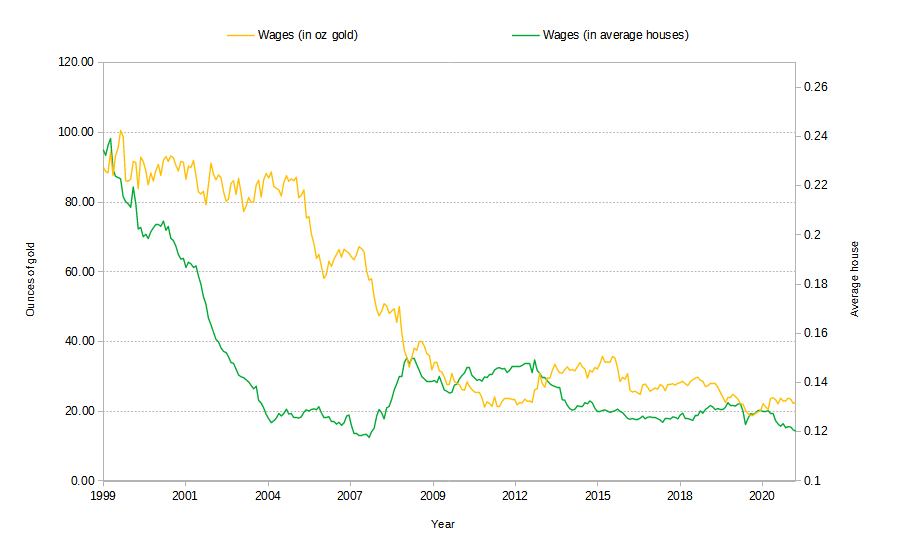
Real wages declined rapidly during the build up to the financial crisis of 2008 when compared to gold and houses as shown in the chart below. The government and Bank of England know that workers protest against pay cuts but not against the destruction of the value of the currency, which is really the same thing, and so they get away with the dishonesty. Despite nominal wages doubling over the period, real wages dropped 75% in terms of gold and 50% in terms of housing after the turn of the century.

Yearly Wages in terms of Gold and House prices, 1999 to 2021. Data from the
Office for National Statistics,
Nationwide Building Society
and
Yahoo Finance